Saurabh Shiral

PortfolioPacific NorthwestEst. 2012

Saurabh Shiral

I move SAP estates onto modern data platforms — and define who runs them after go-live. Thirteen years of that at Accenture. In the margins I build small, finished things: a disaster-recovery drill with a leaderboard, a map of what a country is breathing.

Role
Associate Manager, Accenture
Practice
Migration & run models · SAP · Microsoft Fabric
Based
Bothell, Washington
Sectors
Utilities · Energy · Manufacturing · Pharma

§ 01

About

Thirteen years, one employer, six clients. I joined Accenture in 2012 as an SAP BW developer and have spent the time since inside enterprise data estates — long enough to read a grown legacy landscape and tell you which parts of it should never be migrated at all. These days I lead a multi-wave SAP BW to Microsoft Fabric migration for a Pacific Northwest utility, with a team spread over four countries.

Migration is the easy half. The question I find more interesting is what happens after cutover: who supports this at 2am on the Monday after go-live, what it costs, and how anyone knows it is healthy. So I co-authored the operating model that answers that for my account, co-led a live disaster-recovery failover and wrote the lessons-learned, and kept production reporting running through the whole migration without missing a close.

Enterprise data work teaches you a particular respect for boring problems. A failover that has never been rehearsed. A weekly report nobody reads because it takes an hour to assemble. A dataset that is public, free, and completely illegible. Nobody gets promoted for fixing those, and they are almost always the thing standing between a team and a good week.

So that is what I build in the margins. Everything on this page started as a problem I watched somebody have — usually me — and ended as something small enough to finish on a weekend and complete enough to hand over. Real-time where it has to be, static where it doesn't, and hosted for free wherever possible. They all share a shape: take a process or a dataset nobody enjoys, and make it legible.

§ 02

Selected work

Three built end to end. Each opens with the short version — the labelled blocks below it go deeper only if you want them to.

01 Real-time platform · 2026

Turning a disaster-recovery drill into a race

I co-led a live DR failover exercise on a conference bridge and a spreadsheet, then wrote the lessons-learned. This is what one of those recommendations looks like as software: a pit lane, a live leaderboard, and chaos events fired at you mid-lap.

The problem

SAP system teams are required to rehearse failover. In practice the rehearsal is a conference bridge, a spreadsheet, and four hours of somebody reading steps aloud. When I co-led a real failover-and-failback exercise for a utility client, the structured lessons-learned I wrote afterwards had five themes — and one of them was simply that nobody could see live status.

How it works

An organiser spins up a session in about a minute: name it, set a passphrase they keep, define up to fifteen teams. Out comes a shareable admin link, one read-only observer code, and a six-character join code per team. Participants work their failover issues from their own Pit Lane — resolve, bypass, or log new ones — while a live race view shows every team's position updating over websockets. The organiser broadcasts announcements, fires surprise chaos events, and at the end downloads a full post-mortem workbook.

02 Data & LLM · 2026

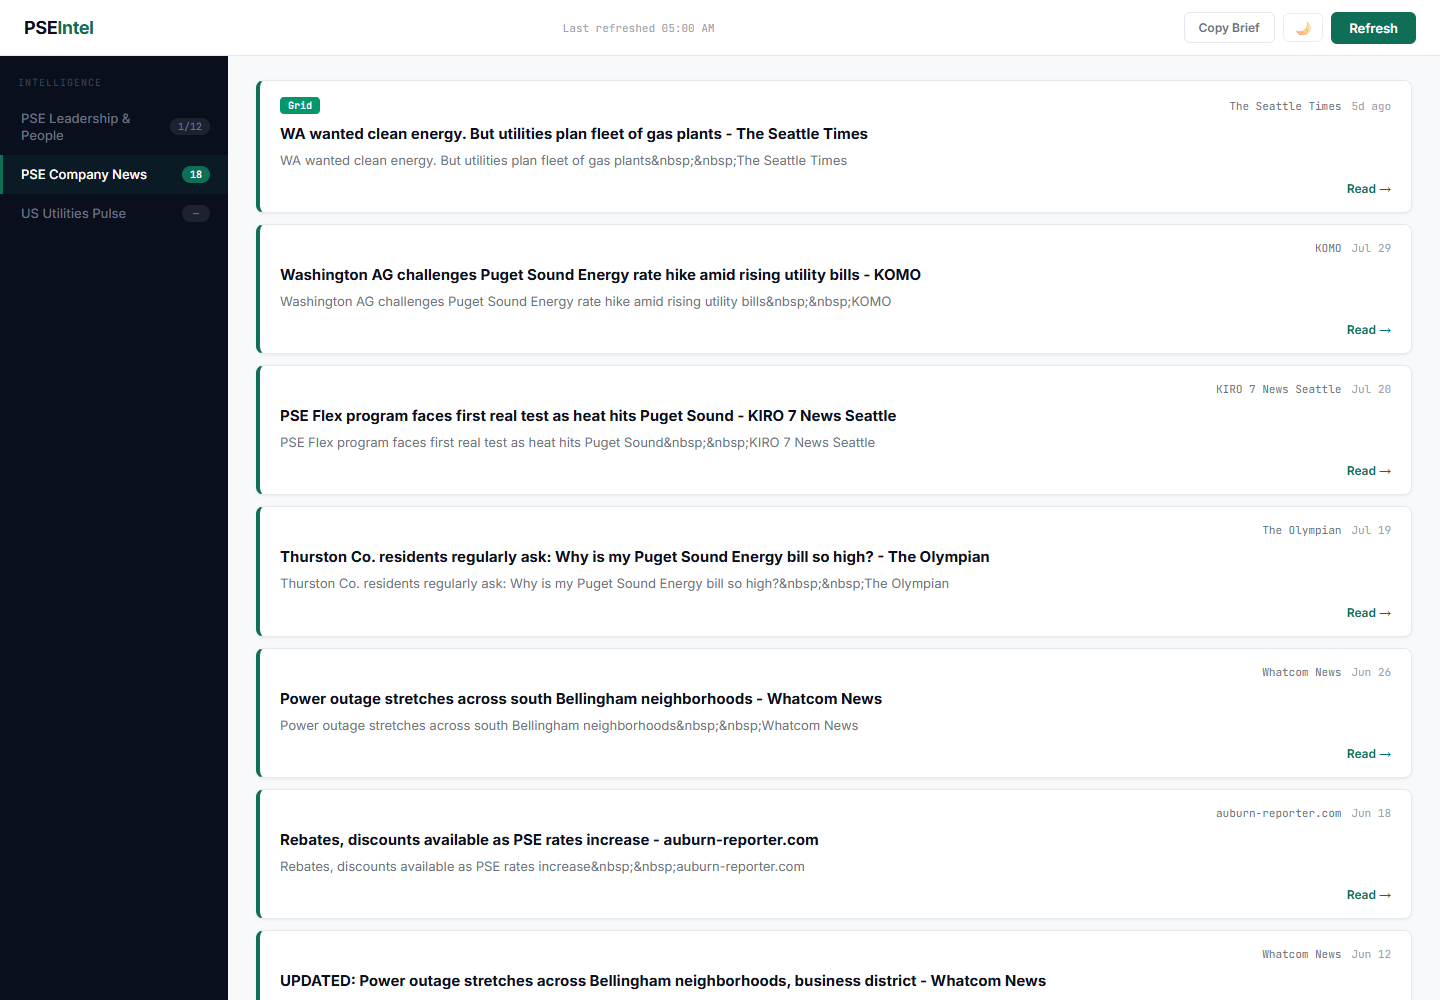
A newsroom staffed by nobody

Feeds in, leadership changes diffed, an AI-summarised digest in the inbox every Monday at 7am Pacific. No server, no database, no cost.

The problem

A delivery team supporting a utility needs to know what is happening to that utility — rate cases, outages, executive churn, the sector generally. Somebody was doing that by hand, badly, which is the natural state of a task that is important on no particular day.

How it works

Three Python files and a cron. monitor.py scrapes the client's leadership and board pages and diffs them against a committed snapshot, so a title change is caught the week it happens rather than the quarter it becomes awkward. digest.py pulls the RSS set, hands it to a Groq-hosted model for summarisation, and posts a formatted HTML email through Office 365. A GitHub Actions workflow runs both weekly and commits the updated snapshot back to the repository.

03 Open data · 2026

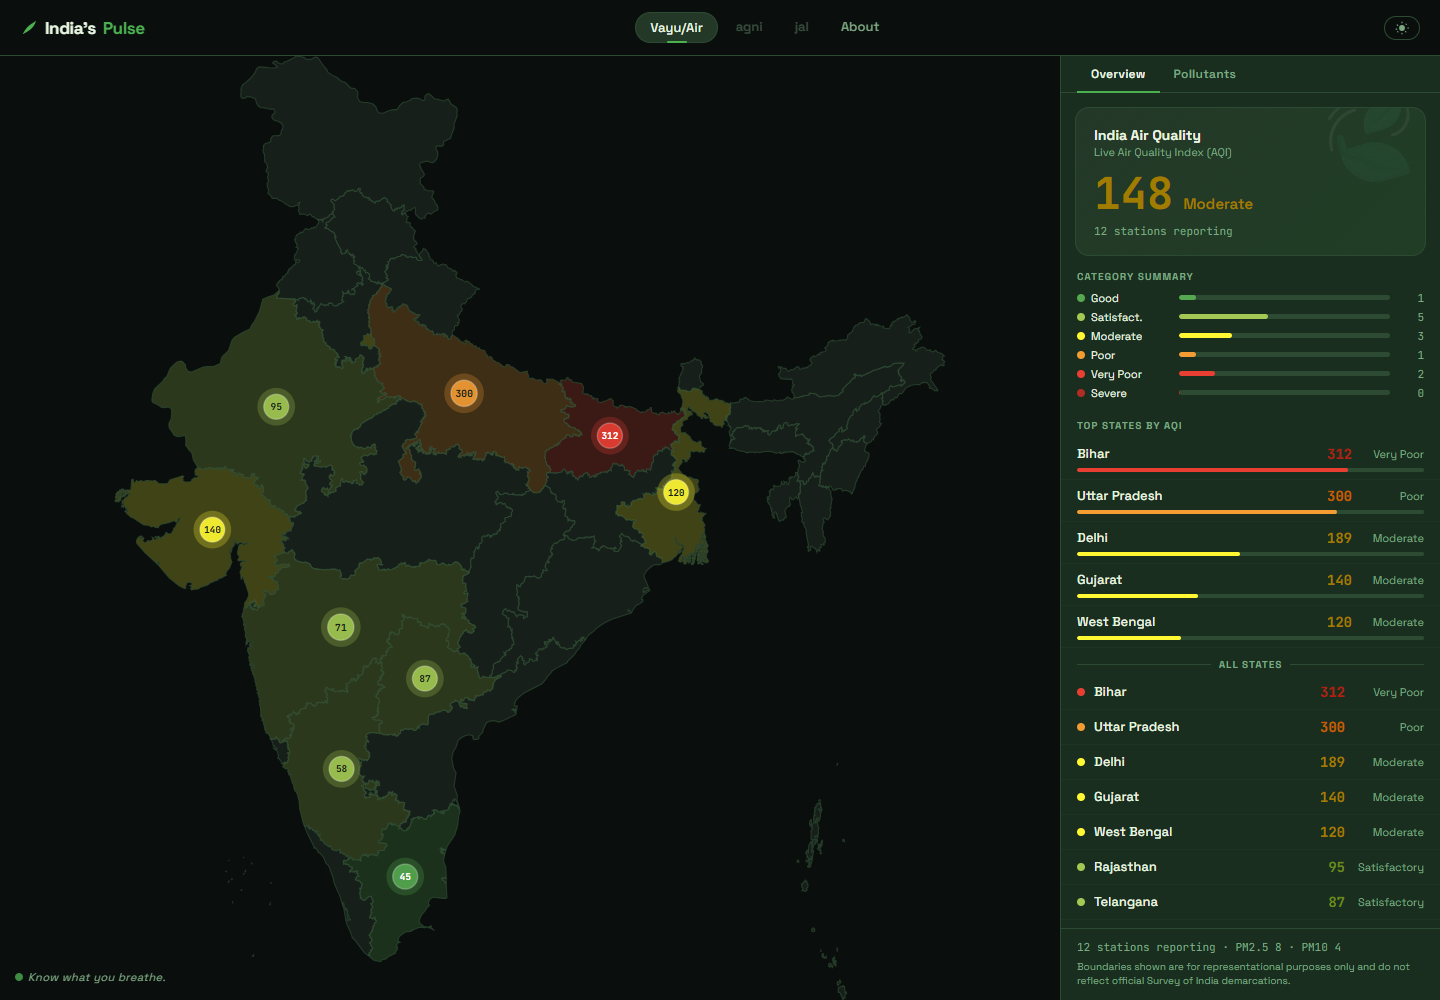
Know what you breathe

Every Indian state's air quality on one map, weighted so the bad cities can't hide behind the good ones.

The problem

India's Central Pollution Control Board publishes live readings from hundreds of monitoring stations, free, through the government open-data portal. It is genuinely open and almost entirely unreadable: raw pollutant concentrations, per station, with gaps.

How it works

Vatavaran — Hindi for environment — turns that into a choropleth of India you can actually read. Concentrations are converted to AQI using the official CPCB breakpoints for PM2.5 and PM10, then rolled up per state. Click any state to drill into its cities, then into individual stations. Astro ships it as static HTML, the data is fetched live in the browser on each load, and GitHub Actions deploys it to Pages.

§ 03

Index of works

Everything else, one row each. Open a row for detail — nothing navigates away.

§ 04

The practice

Thirteen years, one employer, six engagements — developer to delivery lead, build to build-and-run. Clients are described by sector rather than named; they are Accenture's to announce, not mine.

Certifications

  • Microsoft Certified: Fabric Data Engineer AssociateDP-700 · 2026
  • Agentic AI — Level 3A & 3BCrewAI · LangGraph · MCP · ACP · 2026
  • Analytics with SAP Cloud PlatformSAP · 2018

§ 05

What I reach for

Two different toolboxes, kept separate on purpose. The first is what thirteen years pays for; the second is what the weekends are for.

Enterprise stack

SAP data
  • SAP BW
  • BW/4HANA
  • SAP HANA
  • Datasphere
  • BODS
  • BW ABAP
  • BPC
Analytics & BI
  • SAP Analytics Cloud
  • BusinessObjects
  • Analysis for Office
  • Power BI
  • Qlik
Cloud & platform
  • AWS
  • Athena
  • Microsoft Fabric
  • PySpark
  • Data lake architecture
Run the estate
  • AMS operating models
  • ServiceNow
  • Incident & problem management
  • Disaster recovery
  • KT governance
  • Data-protection compliance
Lead the work
  • Agile & Waterfall
  • Estimation
  • Resource planning
  • Stakeholder management
  • Distributed teams
  • Mentoring & hiring panels

Workshop stack

Languages
  • Python
  • JavaScript
  • SQL
  • HTML & CSS
Front end
  • React
  • Astro
  • Vite
  • Tailwind CSS
  • Vanilla / no-build
Back end
  • Flask
  • Socket.IO
  • SQLAlchemy
  • Alembic
  • JWT auth
  • PostgreSQL
AI in practice
  • Groq
  • LLM summarisation pipelines
  • Copilot agent mode
  • CrewAI
  • LangGraph
  • MCP
Ship & run
  • GitHub Actions
  • Docker
  • GitHub Pages
  • Cloudflare Pages
  • Render
  • Neon

§ 06

Get in touch

If something here is useful to you — or you have a boring problem that deserves better — I'd like to hear about it.

navigate open esc close